Playstyle for Victory
Analysis of Football European Teams
Taking a database from Kaggle, in this notebook I analyze some of the Football teams from the most popular European Leagues. The database is composed by 199 columns and 7 tables.
Description of the tables:
Country(11 rows and 2 columns): Describe the countries which the leagues belong to.- id: Country id
- name: Name of the country
League(11 rows and 3 columns): Describe the name of the leagues and the country they belong.- id: League id
- country_id: Country id of the League
- name: Name of the League
Match(26k rows and 115 columns): Describe the different matches among the teams in their leagues. The table specifies the date of the match and the goals every team scored.- id: Id of the match
- country_id: Id of the country
- league_id: Id of the league
- season: Season the match happened in (goes from 2008/2009 to 2015/2016 season)
- home_team_goal
- others
Player(11.1k rows and 7 columns): Describe the player id, their name and features such as birth date, height and weight.- id: Id of the player
- player_name: Name of the player
- birthday: Date of birth of player
- height: Height of the player
- weight: Weight of the player
- others
Player_Attributes(+184k rows and 42 columns): Describes attributes of the different players such as rating, preferred foot, and potential, among others. These values are based in the FIFA attributes.- overall_rating
- potential
- preferred_foot
- attacking_work_rate
- defensive_work_rate
- crossing
- others
Team(299 rows and 5 columns): Describe the teams, with their long and short names, leagues, and id from FIFA.- id: Id of the team
- team_api_id
- team_fifa_api_id
- team_long_name
- team_short_name
Team_Attributes(1458 rows and 25 columns): Descibes teams attributes such as Play of Speed, type of Defence, Creation on Passing, and other parameters that define the playstyle of the teams.- id: Id of the team
- buildUpPlaySpeed
- buildUpPlaySpeedClass
- buildUpPlayDribbling
- buildUpPlayDribblingClass
- buildUpPlayPassing
- buildUpPlayPassingClass
This is a very extensive dataset with more than 11000 players, 300 teams and more than 25k matches. Most of the attributes I mention above are the ones I will be using to answer different questions.
Objectives
The main goal of this analysis if the use of SQL (SQLite) language to extract analytical information to answer specific questions and provide different insights.
Technical skills used in SQLite:
- Joins
- Views
- Common Table Expressions
- Windows Functions
- Nested Queries
Topics addressed in the analysis:
- Best teams per league
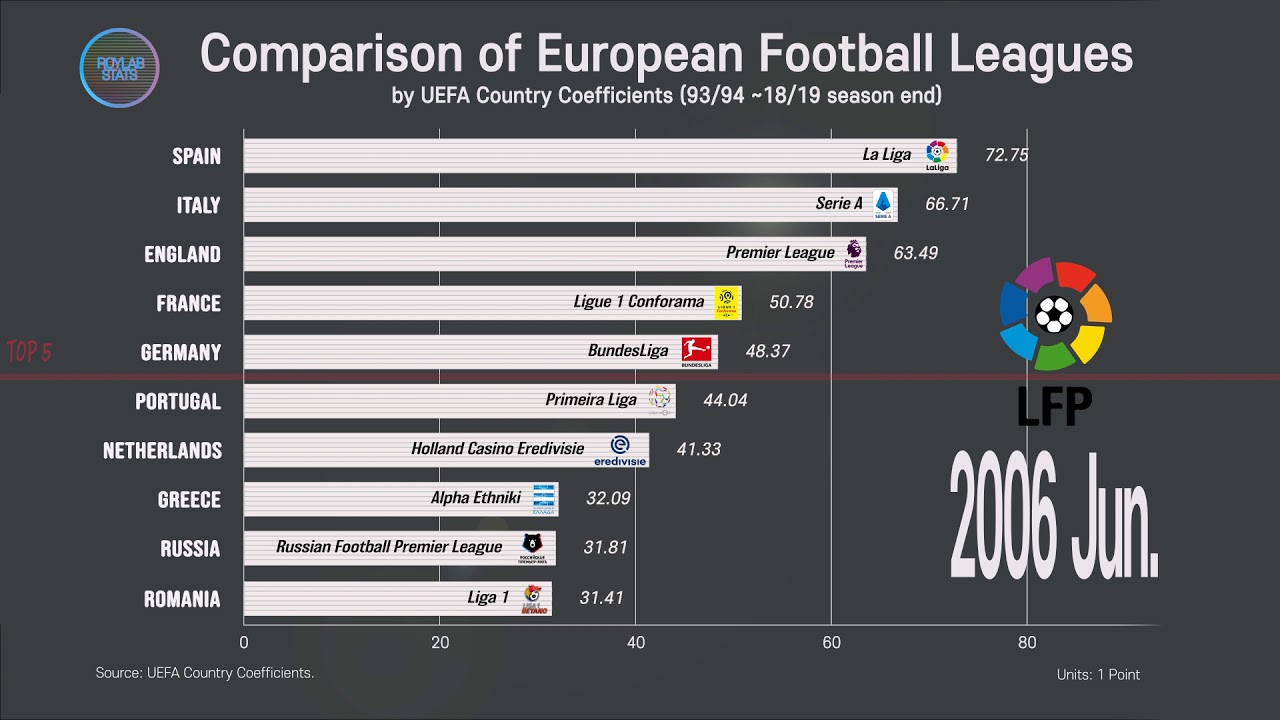
- Best league: I will focus on the 5 biggest and best known leagues: Spain, France, Germany, England and Italy
- Comparison of the teams per league according to their attributes
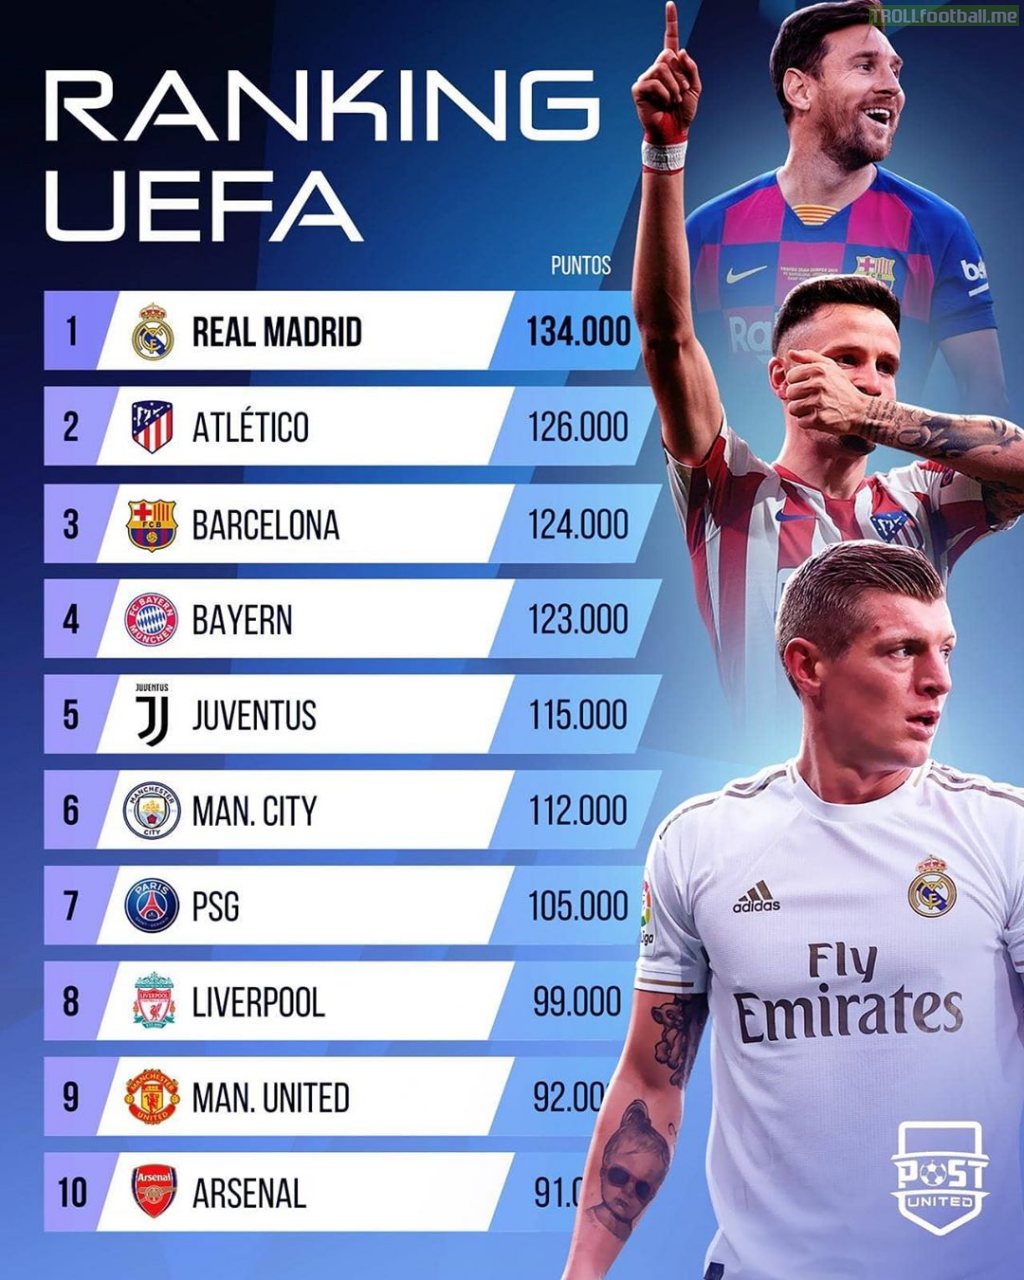
- Best players
Main Question
- What attributes contribute to the victory of a team? Are they definitive?
Table Of Contents:
1. Information of the database
2.1 Analysis of Data Wrangling
3.2 Summary of Classes of Attributes
3.3.1 Top 5 Teams per Attribute
3.3.2 Definning Winners and Lossers
3.3.3 Ranking of Teams per Wins
3.3.4 Best Teams per Season. Summary
3.4.1 Summary of Team Attributes Analysis
3.5 Attributes vs Team Victory
3.5.1 Attributes vs Team Victory. Summary of Results
3.6 Combined Attributes vs Team Victory
3.6.1 Combined Attributes vs Team Victory. Summary of Results